Seismology

Child jumping on the floor in front of the Museum of the Earth's seismology exhibit. Visitors can jump and the vibrations they generate will be displayed on a seismograph.
Acknowledgments
This exhibit is dedicated to the legacy of Cornell Professor Muawia Barazangi (1941-2022).
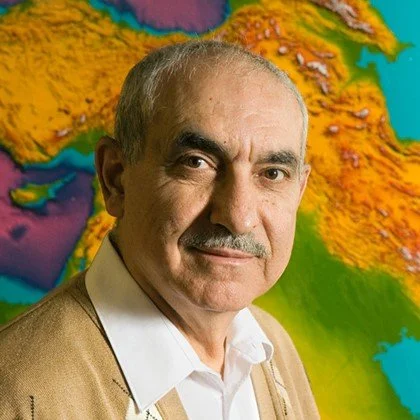
Muawia was a pioneering seismologist and an inspiring mentor, instrumental in acquiring seismology equipment at PRI since the early 2000s, including the lunar seismometer prototype found in this exhibit. Muawia designed the instrument in the late 1960s when he was a graduate student at Columbia University. He went on to become a professor in the Department of Earth and Atmospheric Sciences at Cornell University.
Thank you to PRI staff Rob Ross, Kiera Crowley, Brian Gollands, Leon Apgar, Warren Allmon, and Ingrid Zabel.
Listening to the Earth tells us about what’s under the surface
Earthquakes are more common than you may think. By the time you finish reading this paragraph, many earthquakes will have occurred somewhere in the world. Most of these earthquakes are too small to feel, but sensitive machines called seismometers record vibrations from both small local earthquakes and those that have traveled through and across the globe from larger earthquakes.
Seismic Waves
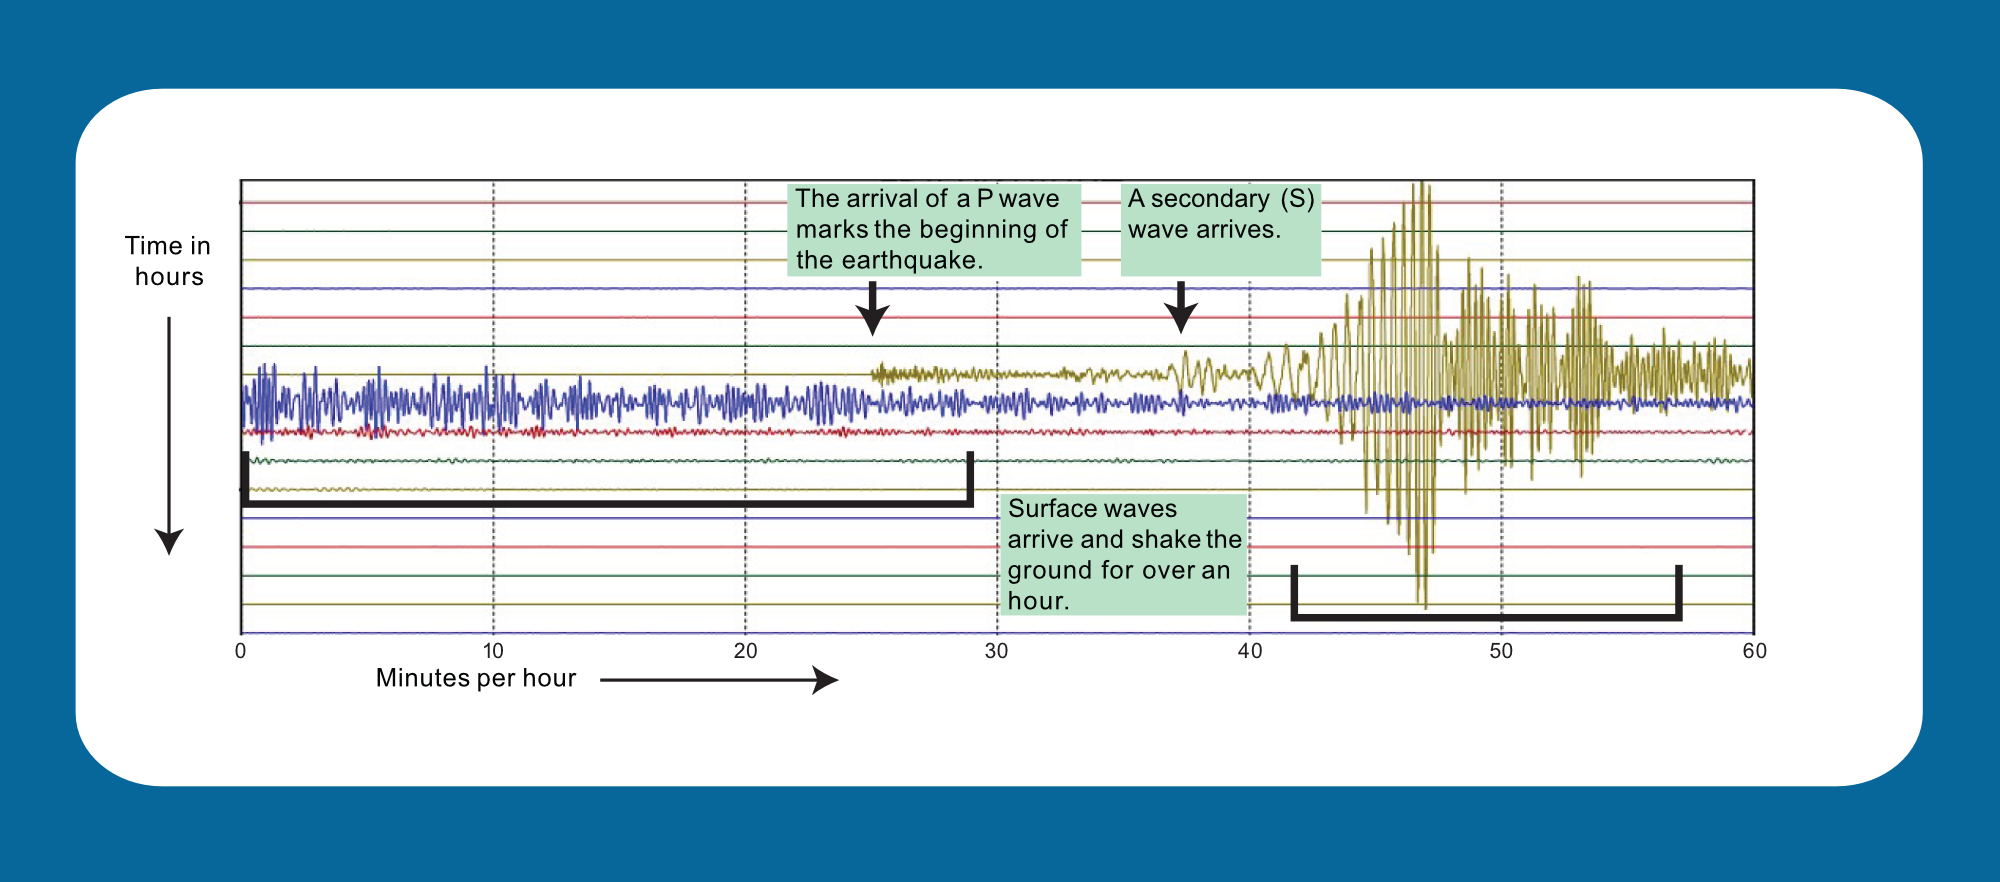
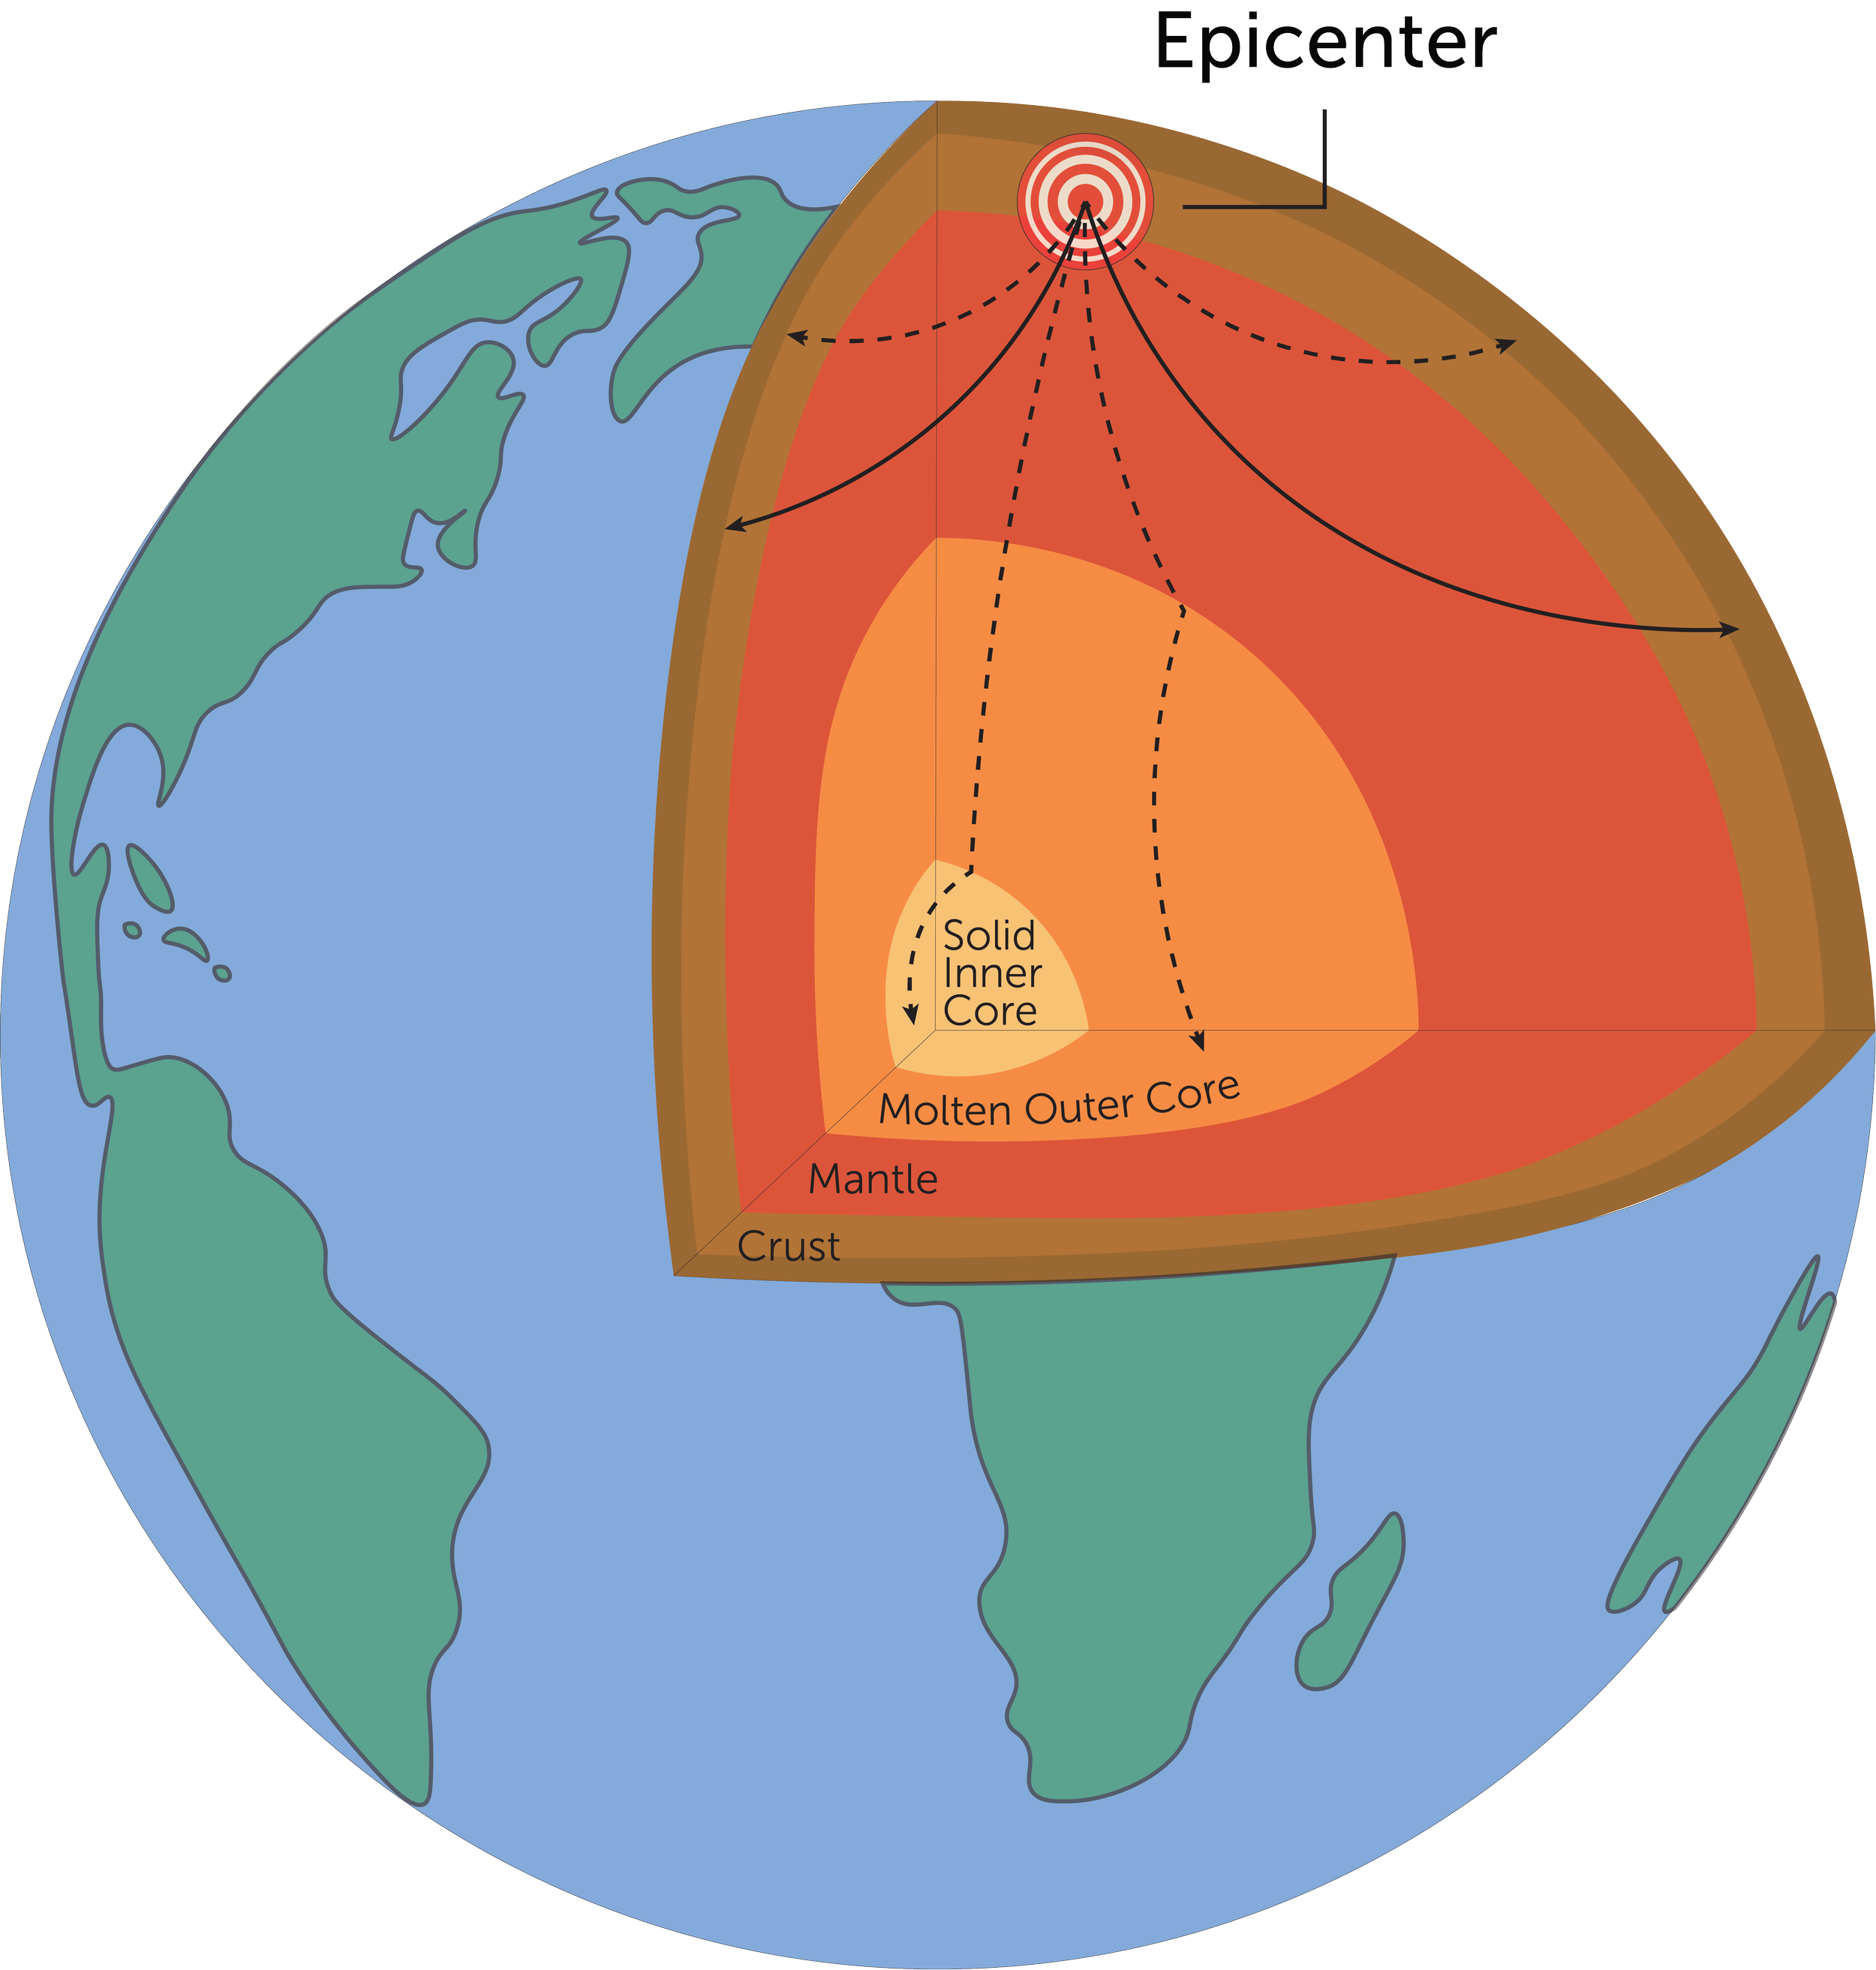
Earthquake vibrations are known as seismic waves. They travel through rock, somewhat like sound waves travel through air. Seismic waves called pressure (P) waves travel through both solid and molten rock. Secondary (S) waves only travel through solids and are slower than P waves. Surface waves are the slowest; these waves are the most destructive to human structures. Using the properties of these waves, Earth scientists learn about the locations (epicenters) and sizes of earthquakes.
Seismic waves are used to study the interior of the Earth. For example, only P waves (dotted lines) travel through the molten core.
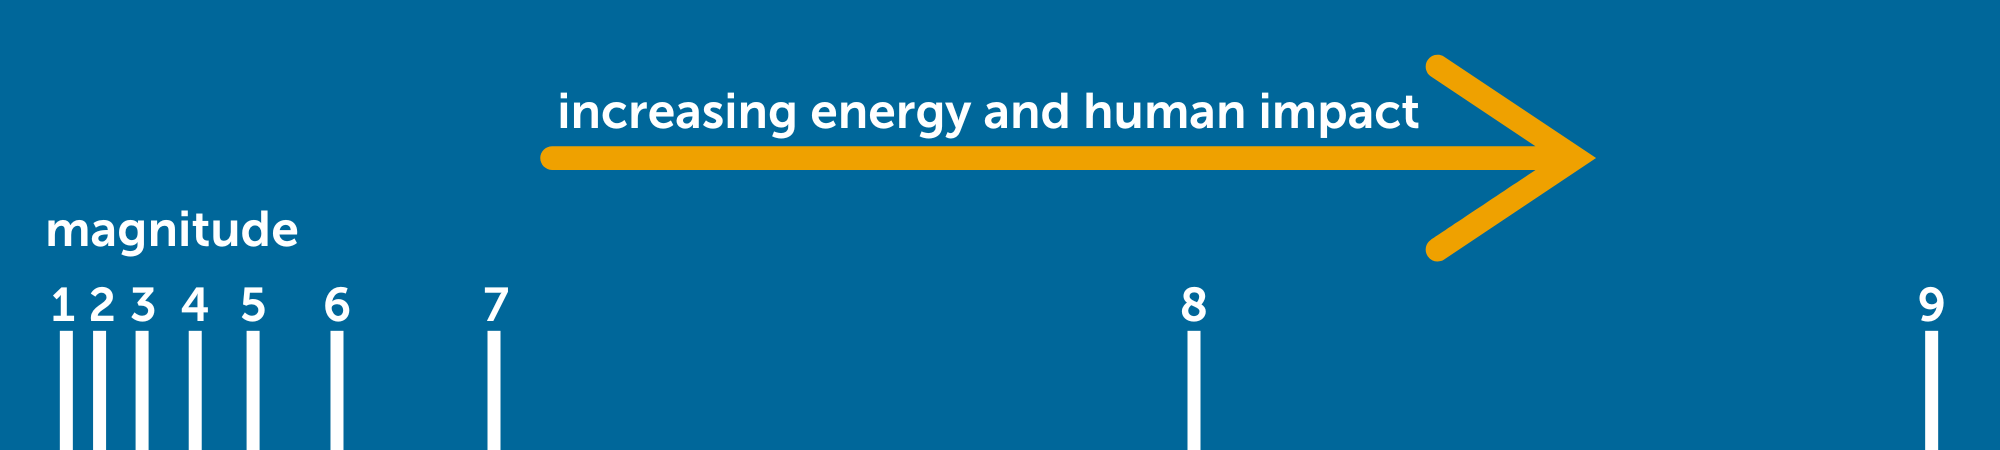
Earthquakes are measured on a scale in which the largest recorded earthquakes are about 9, and earthquakes big enough to feel are above about 3. Each whole number on the scale represents a tremor with 32 times more energy than the whole number below it. A magnitude 3.0 quake, for example, is 32 times more powerful than a magnitude 2.0 quake.
Here is an example of a seismogram, measured by PRI’s seismometer, of the magnitude 8.2 earthquake near Chignik, Alaska on July 29, 2021. Each horizontal line (using alternating colors for clarity) represents one hour. The recording moves from top to bottom and left to right. Notice that the ground moves at PRI for several hours after the initial earthquake.